Habit heatmap: see your habits as a GitHub-style grid
A habit heatmap is a grid with one square per day, shaded by how much of your habits you got done that day. It shows streaks, gaps and patterns at a glance. The two common layouts are GitHub-style, with a column per week, and the year in pixels, with a row per month.
A column per week, a row per weekday. Weekday patterns show up as stripes. Once’s Year view uses this layout for the last 36 weeks.
Less MoreWhy a heatmap works for habit tracking
A streak number tells you about right now. A heatmap tells you the story: when a run started, which weekdays keep slipping, and how a bad week recovered. You can see months of habits in a few seconds.
It also rewards the right thing. One pale square in a dark stretch looks like what it is, a single slip, rather than a streak dropping to zero.
GitHub-style habit tracker vs. year in pixels
A GitHub-style heatmap, named after the contribution graph on GitHub profiles, has seven rows, one per weekday, and a column per week. Because each row is a weekday, patterns like “I always skip Saturdays” show up as a pale stripe.
A year in pixels has a row for each month and a square for each day, so it reads like a calendar. Seasons, holidays and a strong January stand out. Many people start one at New Year.
How to read a habit heatmap
Look for pale rows.
In a GitHub-style grid each row is a weekday. A row that stays pale means that day of the week keeps slipping, so plan for it.Find your longest dark run.
That’s your best stretch. Ask what was different then: the time of day, the cue, how small the habit was.Check how gaps end.
One pale square followed by dark ones is a slip you recovered from. Several in a row is where a habit stalled.Compare the start with the end.
If the grid gets darker over the months, the habit is settling in, even if individual weeks were rough.
Year in pixels for habits
A year in pixels began as a mood tracker: one colour a day for how the day felt. For habits, shade each day by how much you did, from nothing to everything, and the year fills in as a picture of your consistency.
You can keep one on paper, but a habit tracker draws it for you from your check-offs, so it fills in as you log.
In the app
The habit heatmap in Once
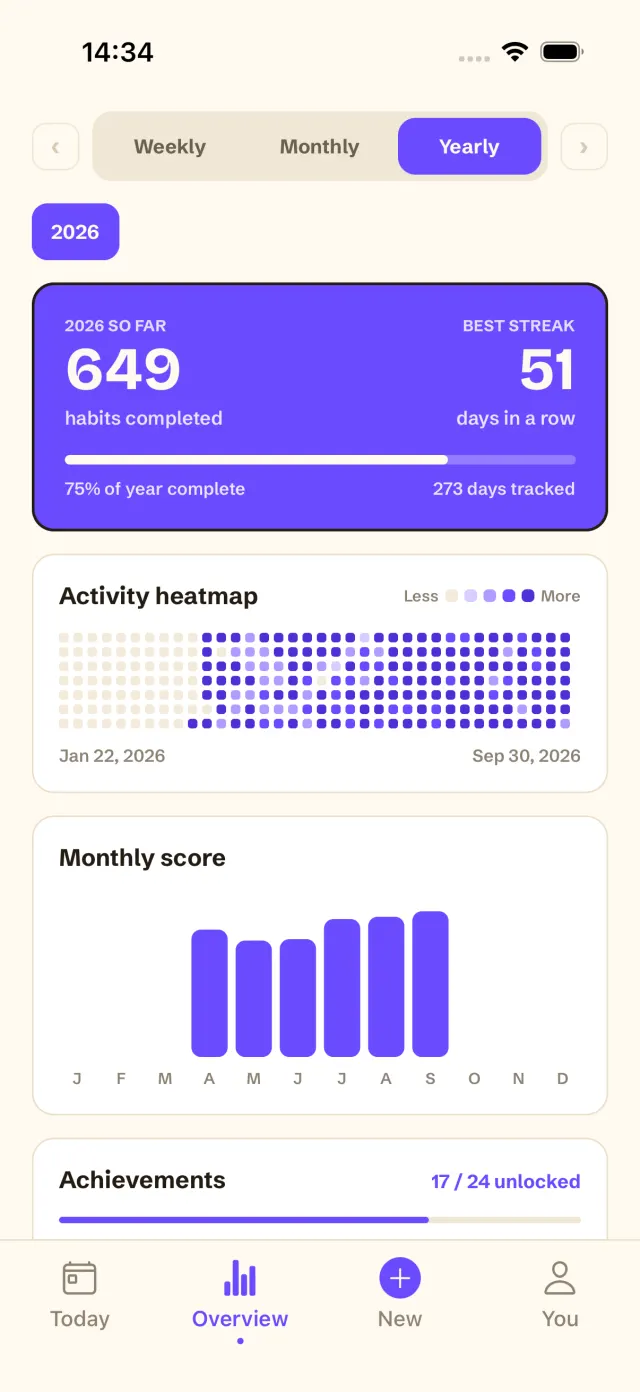
In Once, the Year view’s activity heatmap shows your last 36 weeks as a GitHub-style grid: one dot per day, darker the bigger share of that day’s habits you completed. Beside it are your best streak, how many habits you’ve completed this year and a score for each month.
The Year view and the Month calendar are part of Once Unlimited, a one-time purchase. The free plan includes the Week view’s habit grid: one row per habit, seven days across, each day marked done, missed or not due.
Download on the App StoreQuestions
What is a habit heatmap?
A grid with one square per day, shaded by how much of your habits you completed that day. Darker squares are better days, so streaks and gaps are easy to see.
What is a year in pixels?
A grid with a square for every day of the year, usually twelve rows of months, each coloured by how the day went. It started as a mood tracker and works just as well for habits.
Is there a GitHub-style habit tracker for iPhone?
Yes. Once’s Year view draws your last 36 weeks as a GitHub-style heatmap, one dot per day. It is part of Once Unlimited.
Is the Once heatmap free?
The Year heatmap is part of Once Unlimited, a one-time purchase. The free plan includes the Week view’s habit grid, which shows each habit’s last seven days.
Keep reading